BlueFox, footfall analytics

News

BlueFox Announces Data Partnership with InReality’s Venue Analytics Platform

Industry leaders come together to respond to the need for easier “wide-angle views” of venue analytics and KPI’s. BlueFox announces their partnership with InReality to make it easier for venues and stores to get multi-dimensional, sensor-based analytic views from one platform. InReality’s venue analytics platform harnesses multiple sensor technologies and

Another month, another web dashboard update!

A new version of our foot-traffic dashboard was rolled out at the end of January, bringing new features and enhancements. The Conversion Comparison widget allows you to compare the conversion ratio of a group of sensors. BlueFox analytics reports both the inner range, traffic close to the digital signage or within the shop, and

BlueFox foot-traffic analytics dashboard

Foot-traffic analytics dashboard update

Earlier this week, BlueFox rolled out an updated version of our dashboard, featuring new foot-traffic analytics charts. We have added these new charts for both individual sensors as well as any defined group of sensors. Visualize peak times – First, we included a color-coded heat map that lets you visualize at a

BlueFox heat map

The new BlueFox dashboard is live!

The new foot-traffic analytics dashboard has hundreds of improvements and upgrades. Here are a few highlights:  A slick new Web interface, optimized for any type of display, from your desktop monitor to your tablet to your smartphone screen. Enhanced data aggregation across time periods so you can leverage BlueFox data


I have read and agree to the privacy policy
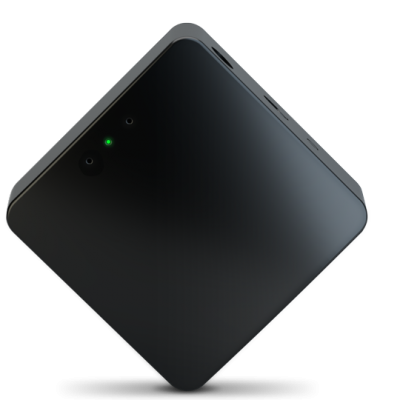
People counter sensor